Market News & Headlines >> Brock Consultant Katie Hancock's Blog: Learn to Read a Bar Chart for Better Marketing

Insights from Brock Associates Consultant Katie Hancock
Free trial of the Brock Report
Technical trading will help you become a better marketer. Before understanding tools and trends associated with technical analysis, let’s look at reading a simple bar chart.
Technical analysis includes a chart that tracks the direction of prices throughout time frames. It’s ideal for finding trends in the market. Whereas fundamental analysis is based on information like the weather and economy, technical analysis is a track of factual price trends. There is no emotion—it is what it is.
I have simplified a bar chart in the following examples:
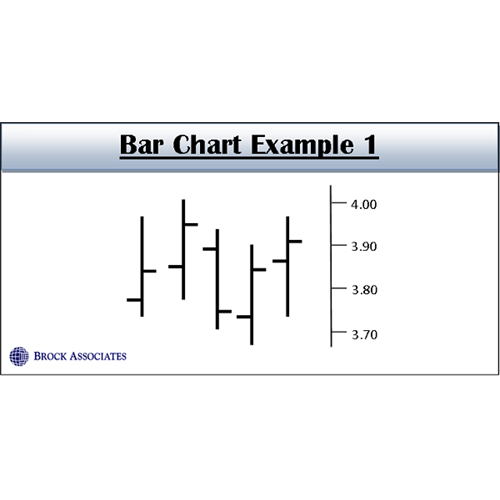
In example one, assume each vertical line is a day. You can view in different time periods like 1 day, 1 week, or 1 month. More advanced traders will watch a closer trading range like one minute. The price range on the far right shows the prices.
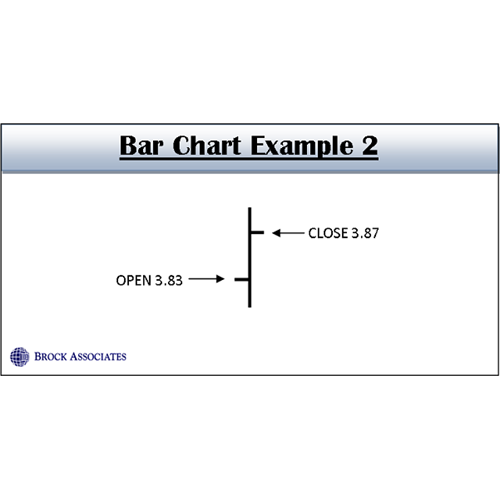
Example two shows the meaning of one trading time frame. The opening price points to the left and the closing price points to the right. For example, the market opened at 3.83 and closed at 3.87.
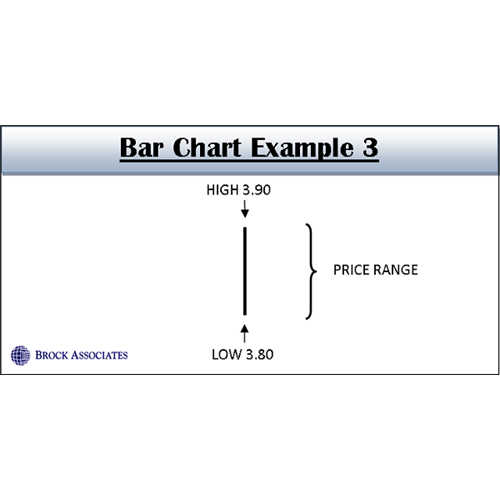
Example three shows the price range for the trading period. In this example, the market traded from 3.80 up to 3.90 in that period. The opening and closing price will be somewhere within that range. Either opening or closing price may be at the high or low of the range.
There are various charts besides a bar chart, but this is the most popular for beginners. Overall, technical trading can make you a better marketer even for those with a basic understanding because the chart will show the trends of the market. The trend is your friend, and bar charts are easy to read for finding major trends and realistic prices.